Properties
![bms energy chart]()
The widget has a number of configurable properties that can be used to modify look, feel, and functionality.
Changing Widget Properties - most properties are self-explanatory but some require some explaining.
Ords:
Main Chart Binding
Set this to an absolute ord, e.g.
station:|slot:/Drivers/NiagaraNetwork/AHU5 or relativized ORD e.g.
slot:AHU5
The ord should point to a numeric point/writable that has a numeric interval extension.
OR
You can reference a history ord directly e.g.
history:/demoStation/AHU5
Daily Benchmarks:
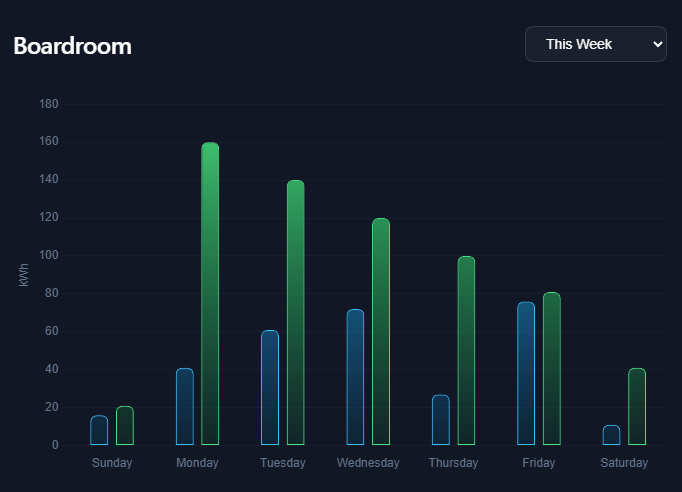
These are the values that your site is aiming for. It is a comma delimited string with 7 numeric values, and starts from Sunday.
You can also point to a string point which contains these values. Set the dailyBenchmarksOrd property instead.
Monthly Benchmarks:
It is a comma delimited string with 12 numeric values, and starts from January. e.g. 1000,1000,800,
800,700,600,600,700,700,800,1000,1000
You can also point to a string point which contains these values. Set the dailyBenchmarksOrd property instead.
Selection Column:
Which rollup column the bql will select. min, max, sum, avg. Default is max
Default Period:
When the chart loads up, it will display a specified period. Options are (case-sensitive):
today
yesterday
weekToDate
lastWeek
lastMonth
lastYear
monthToDate
yearToDate
Refresh Interval:
How often the chart data should refresh. In milliseconds.
Time Format Examples:
-
dddd h:mmtt d MMM yyyy = Friday 9:49am 19 Jan 2018
-
M/d/y = 1/19/2018
-
HH:mm:ss = 09:49:29
-
hh:mm:ss TT = 09:49:39 AM
-
yy/M/d = 18/1/19
-
ddd MMM d \a\t h:mm TT = Fri Jan 19 at 9:49 AM
Previous Version (V2):
You can use the previous version by setting the useVersion property to 2:
![n4 charts]()